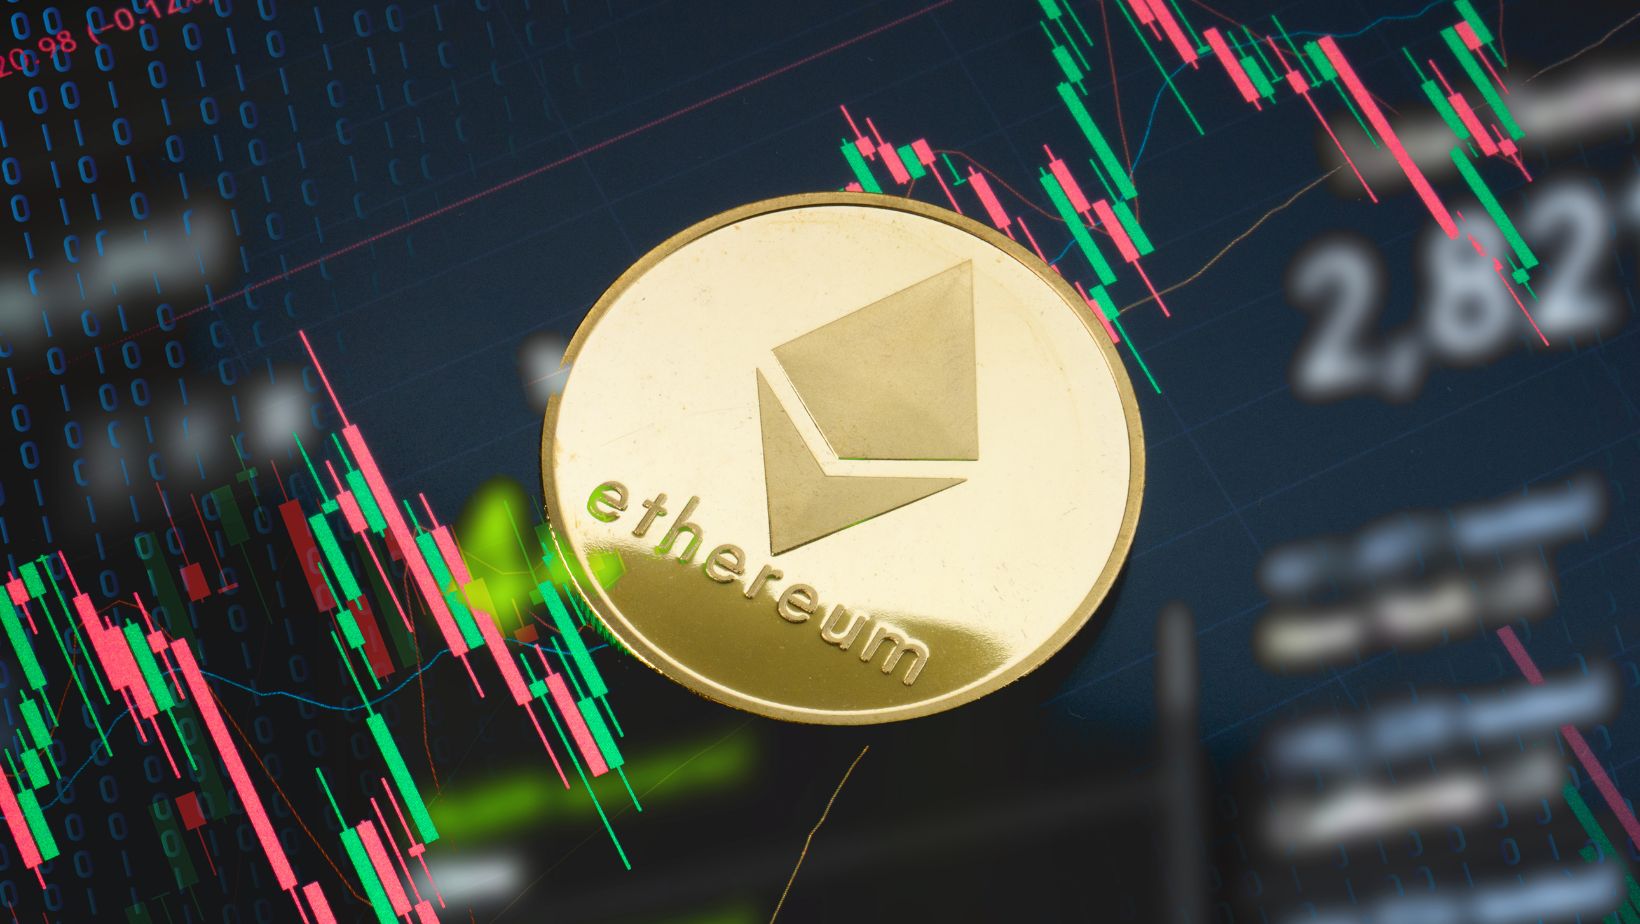
Ethereum (ETH) is a leading platform cryptocurrency in the market because of its strong ecosystem and increasing utility. Since the market is very volatile and data-driven, traders increasingly rely on real-time price analysis to make their investment decisions. One good method of improving these strategies is using Kraken’s Ethereum price charts, a very effective tool for smart and strategic trading.
Understanding Kraken’s Ethereum Price Charts
Kraken’s Ethereum price charts provide a full range of features that empower both new and seasoned traders. The charts display live information, so users can monitor prices as they unfold. The charts are interactive, and users can zoom in and out of time periods and overlay several indicators on one screen. Kraken offers multiple chart types, such as line charts for rapid snapshots and candlestick charts for detailed technical analysis, to suit various trading approaches and analytical requirements.
Key Features Beneficial for Traders
Kraken’s charting platform stands out for a number of reasons:
Real-Time Updates
Kraken’s most powerful tool is its provision of real-time market data. In the volatile world of crypto trading, milliseconds matter. Current updates enable timely responses to unanticipated market trends, timely exploitations of emerging opportunities, and reduced losses. This minute-to-minute access to Ethereum price fluctuation improves the accuracy of decisions.
Historical Data Analysis
Kraken charts also provide users with access to very detailed historical information, so one can examine the past behavior of Ethereum.

It is very important for detecting long-term tendencies, determining periodicity of market trends, and issuing good-quality predictions. Looking through past trends of prices, investors can form tactics based on real market behaviors.
Technical Indicators
Kraken’s charts work with technical indicators such as Moving Averages and Relative Strength Index (RSI). Traders can use these to analyze momentum, identify overbought or oversold levels, and predict reversals. They are fundamental to conducting deep technical analysis and constructing strategies out of quantitative inputs.
Customizable Time Frames
Flexibility is also a feature of Kraken’s Ethereum price charts. Traders can choose among a variety of time frames, from one-minute intervals for short-term trades to multi-year views for long-term analysis. This way, traders can adapt their research to suit particular trading objectives and market strategies.
Strategies for Maximizing Returns Using Kraken’s Charts
To enhance returns, traders must apply the tools available with strategic precision. One method is trend identification. Knowing whether the market is trending upward or downward allows the trader to place themselves in a favorable position, either by entering at a low or riding a rally.
Another fundamental strategy includes examining support and resistance levels. These levels assist in identifying potential price tops and bottoms, which further assist in determining good entry and exit points. Volume analysis is also critical; heavy volumes of trading usually validate the power of price movement to ensure that a breakout or reversal will be maintained.
For the most accurate predictions, it is recommended to combine multiple indicators.

Utilizing tools like RSI with MACD or pairing moving averages with volume metrics increases analytical depth. By doing so, traders can mitigate false signals and gain a more reliable outlook, an approach aligned with the future of digital transformation in data-informed financial decision-making. Even those facing Wi-Fi issues before logging into Kraken’s trading dashboard can appreciate the seamless performance that enhances user experience while executing trades.
Endnote
Kraken’s Ethereum price charts offer a robust and dynamic environment for strategic trading. By leveraging these tools, traders can sharpen their analytical approach, improve timing, and potentially maximize returns.